Help
Web-server usage
A user can input either a wild type (WT) or mutated protein sequence (in case of the latter, calculation
of the WT is also carried out for comparison purposes). Protein embeddings from the pre-trained
ESM-1b model are calculated for the input sequence, and used to:
(i) predict the coupling preferences of the input to G-protein/β-arrestins
(ii) project them on an embedded space encompassing the human GPCRome, and
(iii) visualise the predicted contacts (enriched/depleted) for a given transducer group in 1D (sequence), 2D (contact/attention map) or 3D (structure).
Input format and options
PRECOGx requires input in any of the following formats:
- UniProt ACC/Entry names/Gene symbols: Set of proteins specified using the UniProt accessions, Entry names and Gene symbols
- Mutations: Set of variants/mutations by simply appending the positional information (e.g. D294H), separated by a forward slash (/), to the input ID
- FASTA format: A GPCR specified as whole sequence
- GtoPdb name: A GPCR specified as GtoPdb receptor name (eg: VPAC2 receptor)
- Submit: Execute the input
Output Page
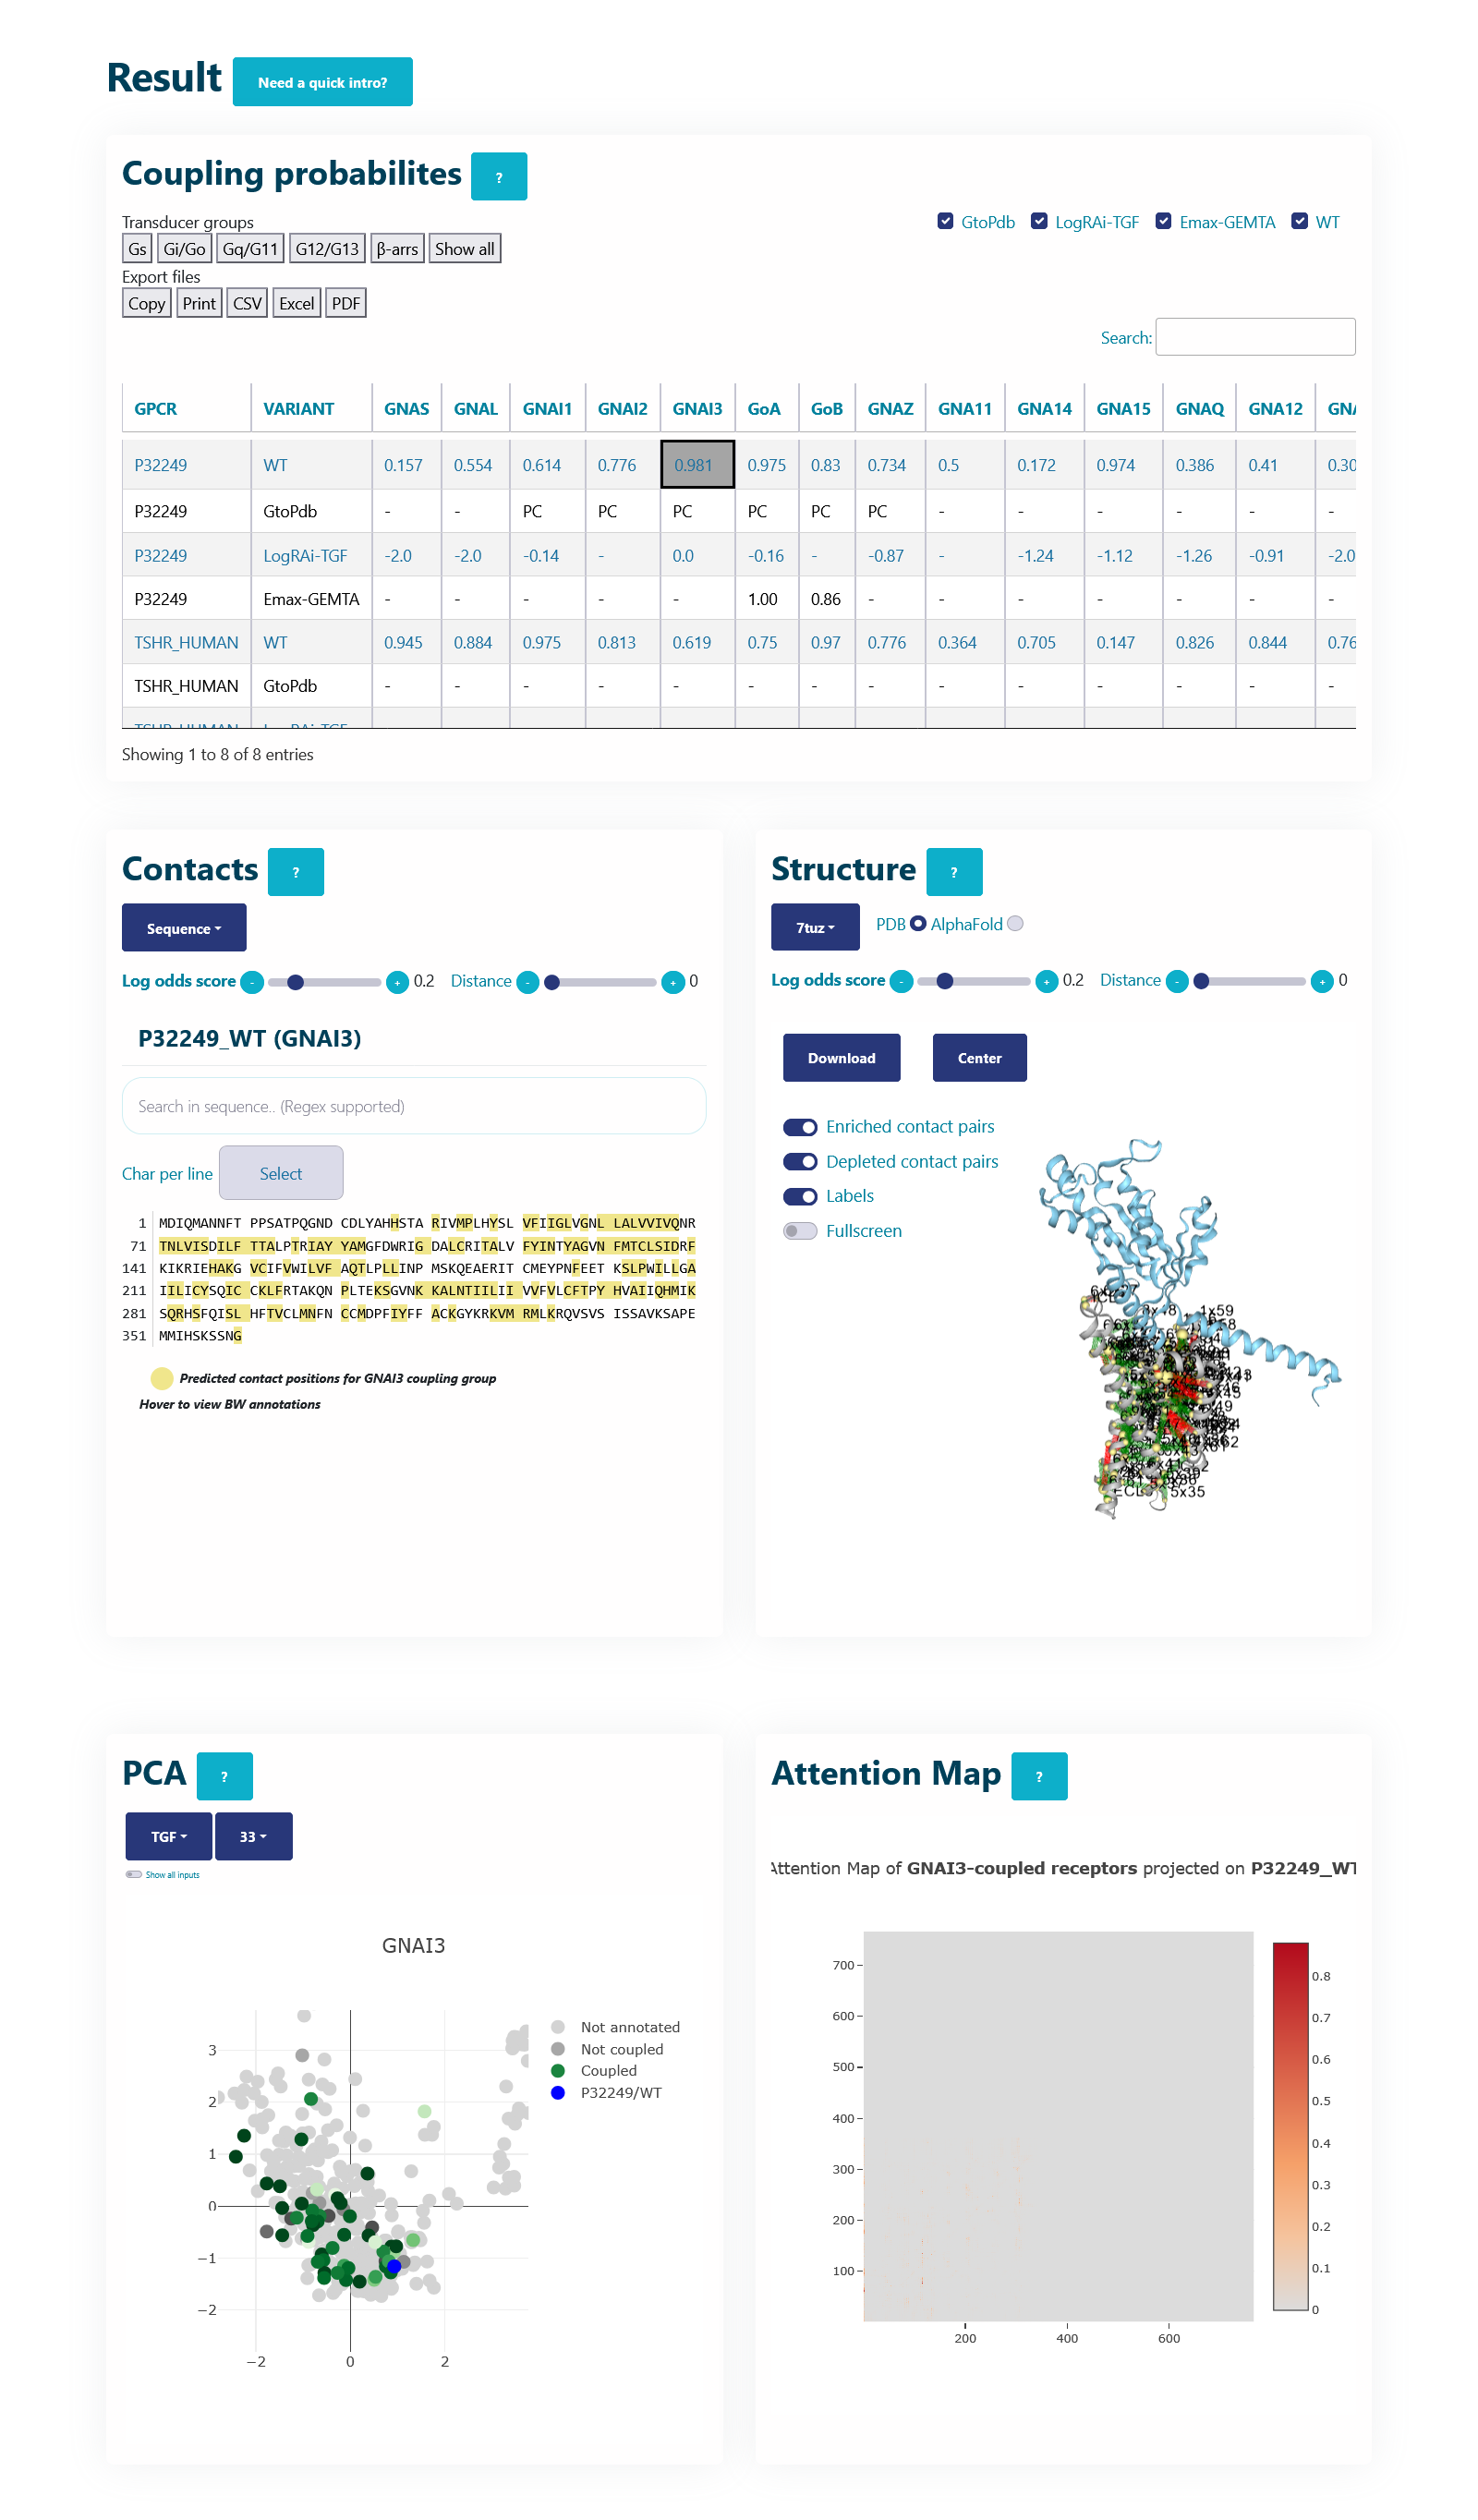
Coupling probabilities panel
The table here represents coupling probabilities predicted by PRECOGx as well experimental information provided by GtoPdb/IUPHAR, the TGF and the GEMTA assays.
Columns:
- GPCR: Input name(s) provided by the user.
- VARIANT: Type of VARIANT - (a) Wild type; (b) Variant/Mutation; (c) GtoPdb; (d) TGF(LogRAi); (e) GEMTA(dnorm Emax)
- [GNAS - β-arr/GRK2]: PRECOGx-predicted coupling probabilities (of both wild type and variant/mutation inputs) for all the available transducer groups (G-proteins and β-arrestins);
Rows with:
- VARIANT = GtoPdb primary coupling is represented by PC while the secondary ones as SC and the unknown ones as -.
- VARIANT = LogRAi-TGF values > -1.0 imply coupled while others are not-coupled (< -1.0) or unknown -.
- VARIANT = Emax-GEMTA values > 0.0 imply coupled while others are not-coupled (= 0.0) or unknown -.
- VARIANT = WT values with PRECOGx-predicted probability > 0.5 are coupled and otherwise, not-coupled.
- VARIANT = Variant/Mutation (eg: D294H - Aspartic acid at sequence position 294 mutated to Histidine) values with PRECOGx-predicted probability > 0.5 are coupled and otherwise not-coupled.
Note: This table acts as the master control. Clicking the cells in the table will automatically update the rest of the panels.
PCA panel
This panel displays the projections of the human GPCRome sequences obtained through Principal Component Analysis (PCA) on the embeddings of the human, non-olfactory GPCRome (shown as dots) for different ESM1b layers (which can be selected from the dropdown menu). The first two components, PC1 and PC2, of the PCA are shown on the X- and Y-axis, respectively. The human GPCRome has a total of 377 receptors (279 Class A, 15 Class B1, 17 Class B2, 17 Class C, 11 Class F, 25 Taste receptors and 14 Others). Place the cursor over a dot to view the GPCR information.
The user can color the human GPCRome based on their known functional information with the help of another drop-down menu:
(i) TGF/GEMTA: The human GPCRome is colored based on its known binding affinities known from the
TGF or
GEMTA assay experiments.
A continuous colour gradient, ranging from dark grey (no binding) to
green (maximum binding), will be applied to the human GPCRome.
(ii) GtoPdb: The human GPCRome is colored based on its known binding affinities known from the
GtoPdb
A discrete color, dark green (primary transduction mechanisms) and
light green (secondary transduction mechanisms), will be applied to the human GPCRome.
(iii) Class: A discrete set of colors will be applied to display the different GPCR classes.
Wild type and Variant (if provided) are projected on the embedded space. You can select a different transducer group by clicking on the appropriate cell in the Coupling probabilites panel.
In the GIF on the right, the variant MC1R/D294H (shown in red; associated with a risk for developing melanoma; PMID: 7581459, 11179997, 17616515) and its wild type (shown in blue) are projected on the embedded space of the human GPCRome, which is colored based on its binding affinities to the GNAS transducer group (left dropdown menu -> TGF/GEMTA) or its class membership (left dropdown menu -> Class) for different Transformer layers (right dropdown menu).
Note: Any activity in this panel will not affect the rendering of other panels.
Contacts panel (Contacts Map)
This plot displays the predicted differential intra-molecular contacts for a given transducer group (G-protein/β-arrestin). The contacts are predicted for all GPCRs, and then grouped together on the basis of their coupling preferences. The contacts are then summarised via log-odds ratio, which indicates the ones that are observed more (enriched in green) or less (depleted in red) frequently than expected. Contacts are shown in their corresponding GPCRdb generic residue numbering scheme. You can select a different transducer group by clicking on the appropriate cell in the Coupling probabilities panel.
The Log-odds score slider can be used to filter and visualize the predicted contacts with an absolute value of the log-odds ratio greater than user-specified absolute value. For example, a slider value of 0.3 will display the predicted contacts that are enriched (> 0.3) or depeleted (< 0.3) for the given transducer group.
The Distance slider can be used to filter close contact pairs inside the same secondary structural element (helices).
In the GIF on the left, the predicted contacts of the GNAS transducer group are projected on the variant MC1R/D294H (associated with a risk for developing melanoma; PMID: 7581459, 11179997, 17616515).
Note: Updating any or both the sliders of this panel will automatically update the sliders and 3D structure in the Structure panel.
Contacts panel (Sequence)
This plot displays the predicted differential contacts for a given transducer group (G-protein/β-arrestin). The intra-molecular contacts are predicted for all the GPCRs, and then grouped together on the basis of their coupling preferences. The contacts are then summarised via log-odds ratio, indicating contacts that are more (enriched) or less (depleted) frequently than expected for the given transducer group. The positions predicted to mediate the contacts (shown in yellow) are mapped to the input sequence. Contacts are shown in their corresponding GPCRdb generic residue numbering scheme. Place the cursor over a position to view its naming in the GPCRdb generic residue numbering scheme. Variant/mutation, if provided, is highlighted in violet. You can select a different transducer group by clicking on the appropriate cell in the Coupling probabilities panel.
The Log-odds score slider can be used filter and visualize the predicted contacts with the log-odds ratio greater than user-specified absolute value. For example, a slider value of 0.3 will display the predicted contacts that are enriched (> 0.3) or depeleted (< 0.3) for the given transducer group.
The Distance slider can be used to filter close contact pairs inside the same secondary structural element (helices).
In the GIF on the right, the predicted contacts of the GNAS transducer group are projected on the variant MC1R/D294H (associated with a risk for developing melanoma; PMID: 7581459, 11179997, 17616515).
Note: Updating any or both the sliders of this panel will automatically update the sliders and 3D structure if the Structure panel.
Attention map
This panel displays the attention map outputted by the most important attention head of the best performing embedding layer (not shown) during training of the given transducer group (G-protein/β-arrestin). The labels on the X- and Y-axis represent the input sequence positions.
Darker the color, higher is the importance of the pair of positions in the input. The user can compare the attention network of one or more variants (by specifying in the input) with the wild type. You can select a different transducer group by clicking on the appropriate cell in the Coupling probabilities panel.
In the GIF on the left, the attention map of the GNAS transducer group is projected on the variant MC1R/D294H (associated with a risk for developing melanoma; PMID: 7581459, 11179997, 17616515). The mutation site is one of several found inside a characteristic attention signature centred on residue 170.
Note: Any activity in this panel will not affect the rendering of other panels.
Structure Panel
This plot displays the predicted differential contacts for a given transducer group (G-protein/β-arrestin). The contacts are predicted for all the GPCRs, and then grouped together on the basis of their coupling preferences. The contacts are then summarised via log-odds ratio, indicating contacts that are more (enriched) or less (depleted) frequently than expected for the given transducer group. Contacts are shown in their corresponding GPCRdb generic residue numbering scheme.
The positions predicted to mediate the contacts (shown as yellow spheres) are mapped to 3D structure of the input. The contact pairs are connected by a line, with the enriched pairs shown in green and the depeleted ones in red. The 3D structure with highest sequence identity to the input GPCR (computed using PSI-BLAST against PDB and AlphaFold complexes) is chosen and displayed by default. The user can select another 3D structure from the dropdown menu, which ranked in the descending order of sequence identity with the input receptor.
Variant/mutation, if provided, is highlighted as a violet sphere. You can select a different transducer grop by clicking on the appropriate cell in the Coupling probabilities panel.
The Log-odds score slider can be used filter and visualize the predicted contacts with the log-odds ratio greater than user-specified absolute value. For example, a slider value of 0.3 will display the predicted contacts that are enriched (> 0.3) or depeleted (< 0.3) for the given transducer group.
The Distance slider can be used to filter close contact pairs inside the same secondary structural element (helices).
In the GIF on the right, the predicted contacts of the GNAS transducer group are projected on the variant MC1R/D294H (associated with a risk for developing melanoma; PMID: 7581459, 11179997, 17616515).
Note: Updating any or both the sliders of this panel will automatically update the sliders of the Contacts panel.
Download
Download is available as TSV format (Tab-Separated Values). This files provides the PRECOGx-predicted coupling probabilties as well as information of the input known through experimental assays.
Column information:
- GPCR: Input name(s) provided by the user.
- VARIANT: Type of variants - (a) Wild type; (b) Mutation; (c) GtoPdb; (d) TGF(LogRAi); (e) GEMTA(dnorm Emax)
- [GNAS - β-arr/GRK2]: PRECOGx-predicted coupling probabilities (of both wild type and variant/mutation inputs) for all the available transducer groups (G-proteins and β-arrestins);
Rows with:
- VARIANT = GtoPdb primary coupling is represented by PC while the secondary ones as SC and the unknown ones as -.
- VARIANT = LogRAi-TGF values > -1.0 imply coupled while others are not-coupled (< -1.0) or unknown -.
- VARIANT = Emax-GEMTA values > -0.0 imply coupled while others are not-coupled (= 0.0) or unknown -.
- VARIANT = WT values with PRECOGx-predicted probability > 0.5 are coupled and otherwise, not-coupled.
- VARIANT = Variant/Mutation (eg: D294H - Aspartic acid at sequence position 294 mutated to Histidine) values with PRECOGx-predicted probability > 0.5 are coupled and otherwise not-coupled.
Browser compatibility
| OS | Version | Chrome | Firefox | Safari |
|---|---|---|---|---|
| Linux | Ubuntu 20.04.3 LTS | not tested | 95.0 | n/a |
| Linux | CentOS 7.2.1511 | not tested | ESR 52.6.0 | n/a |
| Windows | 10 | v96.0.4664.110 | n/a | |
| MacOS | BigSur v11.5.2 | v96.0.4664.110 | v95.0.2 | 14.1.2 |
| MacOS | BigSur v11.6 | v96.0.4664.110 | v95.0.2 | 14.1.2 |
Contacts
Francesco Raimondi - francesco.raimondi@sns.it
Marin Matic - marin.matic@sns.it
Gurdeep Singh - gurdeep.singh@bioquant.uni-heidelberg.de
If you are facing any issues in viewing the result page, please provide (if possible) the URL of your results page in the email.