About - Methods
We developed PRECOGx, a machine learning predictor of GPCR interactions with G-protein and β-arrestin, by using the ESM1b protein embeddings as features and experimental binding datasets.
We also developed precog3D, a structure-based predictor of GPCR-G protein coupling trained on AlphaFold 3 models of GPCR-G protein complexes.
Embeddings generation
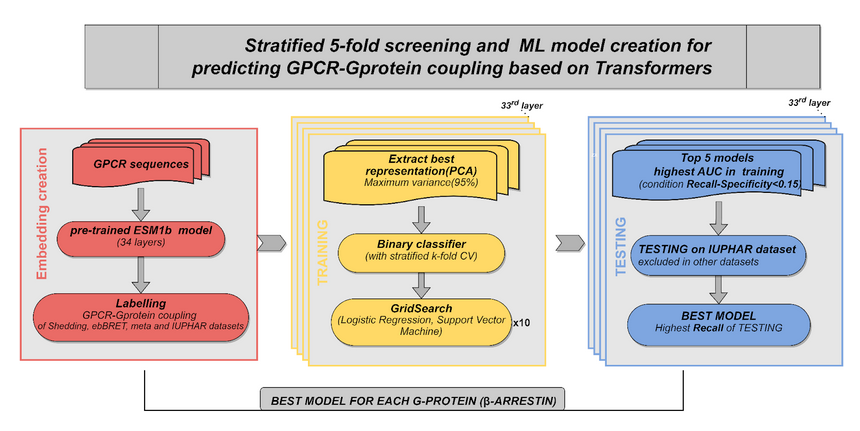
Embeddings of the protein sequences were generated by using pre-trained protein language models that have been recently released. We computed embeddings from fasta sequence using the extract.py function of the ESM library and by specifying the ESM-1b model (esm1b_t33_650M_UR50S) with embedding for individual amino acids as well as averaged over the full sequence using the option “--include mean per_tok”.
We generated embeddings for each individual layers separately, including the final one, by specifying their corresponding number in the “--repr-layers” option.
Data sets
We obtained experimental binding affinities from two distinct sources: TGF assay(12), which captures the binding affinities of 148 GPCRs with 11 chimeric G-proteins, and the ebBRET assay, which profiles the binding affinities of 97 GPCRs with 12 G-proteins and 3 β-arrestins/GRKs binders, available at gpcrdb. We also used an integrated meta-coupling dataset derived from a meta-analysis of the aforementioned assays, entailing binding affinities of 164 GPCRs for 14 G-proteins. For the TGF assay, we considered a receptor coupled to a G-protein if the logarithm (base 10) of the relative intrinsic activity (logRAi) was greater than -1, and not-coupled otherwise. Similarly, for the GEMTA assay, we considered a receptor coupled to a G-protein (or β-arrestins/GRK) if the binding efficacy (dnorm Emax) was greater than 0, and not-coupled otherwise. For the integrated meta-coupling dataset, we considered a receptor coupled to a G-protein if the integrated binding affinity was greater than 0, and not-coupled otherwise.
Model training
We developed the new PRECOGx by training multiple models using the protein embeddings derived from the pre-trained ESM-1b model as features. For every pair of a coupling group (G-protein/β-arrestins) and assay dataset (TGF/GEMTA assays), we created a training matrix with vectors, each containing the decomposed PCA values of a receptor embedding along with the binary label (coupled/not-coupled) as the last element. We implemented the predictor using either a logistic regression or support vector classifier from the Scikit library library. A grid search was performed using a stratified 5-fold cross validation (CV) to select the best hyperparameters of the classifier. We repeated the process 10 times to ensure a minimum variance. We generated a total of 34 models per G-protein (or β-arrestin) and assay. The best models were chosen based on the highest AUC (Area Under the Curve) score during the 5-fold cross-validation.
Model testing
We benchmarked our method against PRECOG, the web-server for GPCR/G-protein coupling predictions that we previously developed. We obtained an independent list of 117 (TGF assay data as the training set), and 160 receptors (GEMTA assay as the training set) from the GtoPdb that are absent in both the assay datasets. Since GtoPdb lacks a proper true negative set, we used Recall (REC) as a measure to compare the performance of PRECOGx with PRECOG. To assess over-fitting, we performed the randomization test by randomly shuffling the original labels of the training matrix, while preserving the ratio of the number of coupled to not-coupled receptors.
PCA of the GPCRome embedded space
We generated embeddings for the human GPCRome, comprising a total of 377 receptors (279 Class A, 15 Class B1, 17 Class B2, 17 class C, 11 class F, 25 Taste receptors and 14 in other classes). We considered either the embeddings generated by considering all the layers. Embeddings were subjected to Principal Component Analysis (PCA), using the PCA function from the Scikit library. Each GPCR sequence within the embedding is annotated with functional information (i) coupling specificities (known from the TGF assay, GEMTA assay, the GtoPdb, and the STRING (for β-arrestins) databases; (ii) GPCR class membership (known from the GtoPdb).
Contact analysis
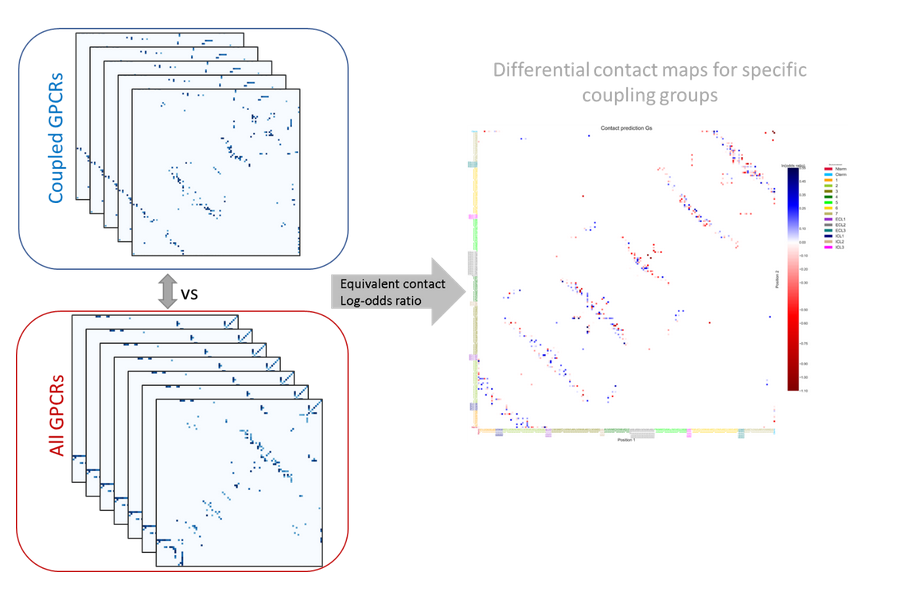
To interpret the determinants of binding specificity, we first calculated predicted contacts for each sequence using a logistic regression over the model's attention maps, available in the ESM library through the predict_contacts function. Then, the predicted contact maps were grouped on the basis of G-protein binding specificity and contrasted to the contact maps of all the GPCRs which was used as a background. We computed a differential contact maps by calculating a log-odds ratio, employing the following formula:
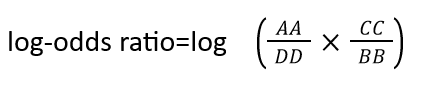
Where AA and BB terms represent a number of coupled GPCR to a specific G-protein depending on the assay , that has or does not have a specific contact pair respectively. CC and DD terms represent the number of not-uncoupled GPCR for a specific G-protein depending on the assay, that has or does not have a specific contact pair respectively. Contacts contributed from the loops, N-terminal, and C-terminal of the GPCR were aggregated. Contact pairs considered are those with a probability higher than 0.5 calculated based on predict_contacts function and those appearing in at least 15% of all GPCR in the assays. We computed log-odds ratio using the Table2x2 function from StatsModels. The resulting log-odds ratio was normalized using the MaxAbsScaler from Sscikit-learn.Contacts with a positive log-odds ratio (enriched) are seen more frequently in receptors coupled to a specific G-protein, while contacts with a negative log-odds ratio (depleted) are seen less frequently in receptors coupled to a specific G-protein.
Attention maps
By inspecting the weights of the trained classifiers, we extracted the most important attention head, for the best performing layer of each coupling group. Attention maps are calculated during embedding generation for each input sequence and are displayed as 2D heatmaps.
precog3D
Structure prediction
We used AlphaFold 3 (v3.0.1) to model each GPCR in complex with a Gα subunit, GNB1 and GNG1. GPCR N-termini were truncated to 50 residues upstream of TM1 and C-termini to 100 residues downstream of helix H8. Only templates released before 30 September 2021 were allowed, seed 0 was used, and the model with the best ranking score out of 5 was kept. Residues with pLDDT < 70 were removed, except the 7 C-terminal residues of Gα. The models were validated against experimental structures released after the AlphaFold 3 training cutoff using DockQ.
Structural features
A total of 92 features were derived from each model, plus their normalized versions (184 in total): AlphaFold 3 ranking score, ipTM, interaction probability, pDockQ, pLDDT of GPCR and G protein interface residues, contact probabilities between interface residue pairs, interaction probability of the Gα C-terminal residues, and Rosetta InterfaceAnalyzer ΔG, ΔSASA and ΔG/ΔSASA after relaxation of the structure. Normalized features are obtained by subtracting the average of the same feature across the 13 complexes of the same GPCR.
Model training and testing
The model is a regression model based on the tabular foundation model TabPFN (v2.0.9), trained on 1,714 experimental GPCR-G protein pairs (213 GPCRs) from GproteinDb. The training objective was max(log10(c), 0.1), where c is the coupling activity measured as % of the primary transducer. Performance was evaluated by repeated (5 times) 5-fold cross-validation partitioned at the receptor level. The cutoff to discriminate coupled from not-coupled pairs (4% of primary transducer activity) is the one maximizing the Matthews correlation coefficient.
We tested precog3D on 316 couplings (114 positive, 202 negative; 79 receptors) from the GtoPdb absent from the training set, and benchmarked it against PRECOGx retrained on the same GproteinDb data. Robustness was assessed with leave-one-GPCR-out and leave-one-G-protein-out procedures. Feature importance was computed with SHAP.
GPCRome-wide predictions
The model, fitted on all the experimental pairs, was used to predict the coupling of the remaining 3,395 non-olfactory and 5,304 olfactory GPCR-G protein pairs, for 13 Gα subunits.
Data and code
Code: github.com/raimondilab/Precog3D
Libraries used
Following libraries were used to build the webserver:
- ESM
- NGL viewer
- jQuery
- neXtProt
- Bootstrap
- Flask
- Scikit-learn
- DataTables
- Plotly
- PDBe Molstar
Cite
PRECOGx: Marin Matic, Gurdeep Singh, Francesco Carli, Natalia De Oliveira Rosa, Pasquale Miglionico, Lorenzo Magni, J Silvio Gutkind, Robert B Russell, Asuka Inoue, Francesco Raimondi, PRECOGx: exploring GPCR signaling mechanisms with deep protein representations, Nucleic Acids Research, Volume 50, Issue W1, 5 July 2022, Pages W598–W610, https://doi.org/10.1093/nar/gkac426
precog3D: Pasquale Miglionico, Marin Matic, Luca Franchini, Hiroki Arai, Lorenzo Amir Nemati Fard, Chakit Arora, Magda Gherghinescu, Natalia De Oliveira Rosa, Ryoji Kise, J. Silvio Gutkind, Cesare Orlandi, Asuka Inoue, Francesco Raimondi, Computed atlas of the human GPCR-G protein signaling complexes, bioRxiv (preprint), 2026, https://doi.org/10.64898/2026.03.07.710286
Contact
Francesco Raimondi - francesco.raimondi@sns.it
Pasquale Miglionico - pasquale.miglionico@sns.it
Marin Matic - marin.matic@sns.it
Gurdeep Singh - gurdeep.singh@bioquant.uni-heidelberg.de